
Buying your first home is one of the most exciting milestones in life. It can also feel overwhelming, especially in a market like Richmond where there’s a lot to learn before you start.
The good news? A little preparation goes a long way. Here are five things I wish every first-time buyer knew before they started their search.
1. Understand the BC Property Transfer Tax — and Whether You Qualify for an Exemption
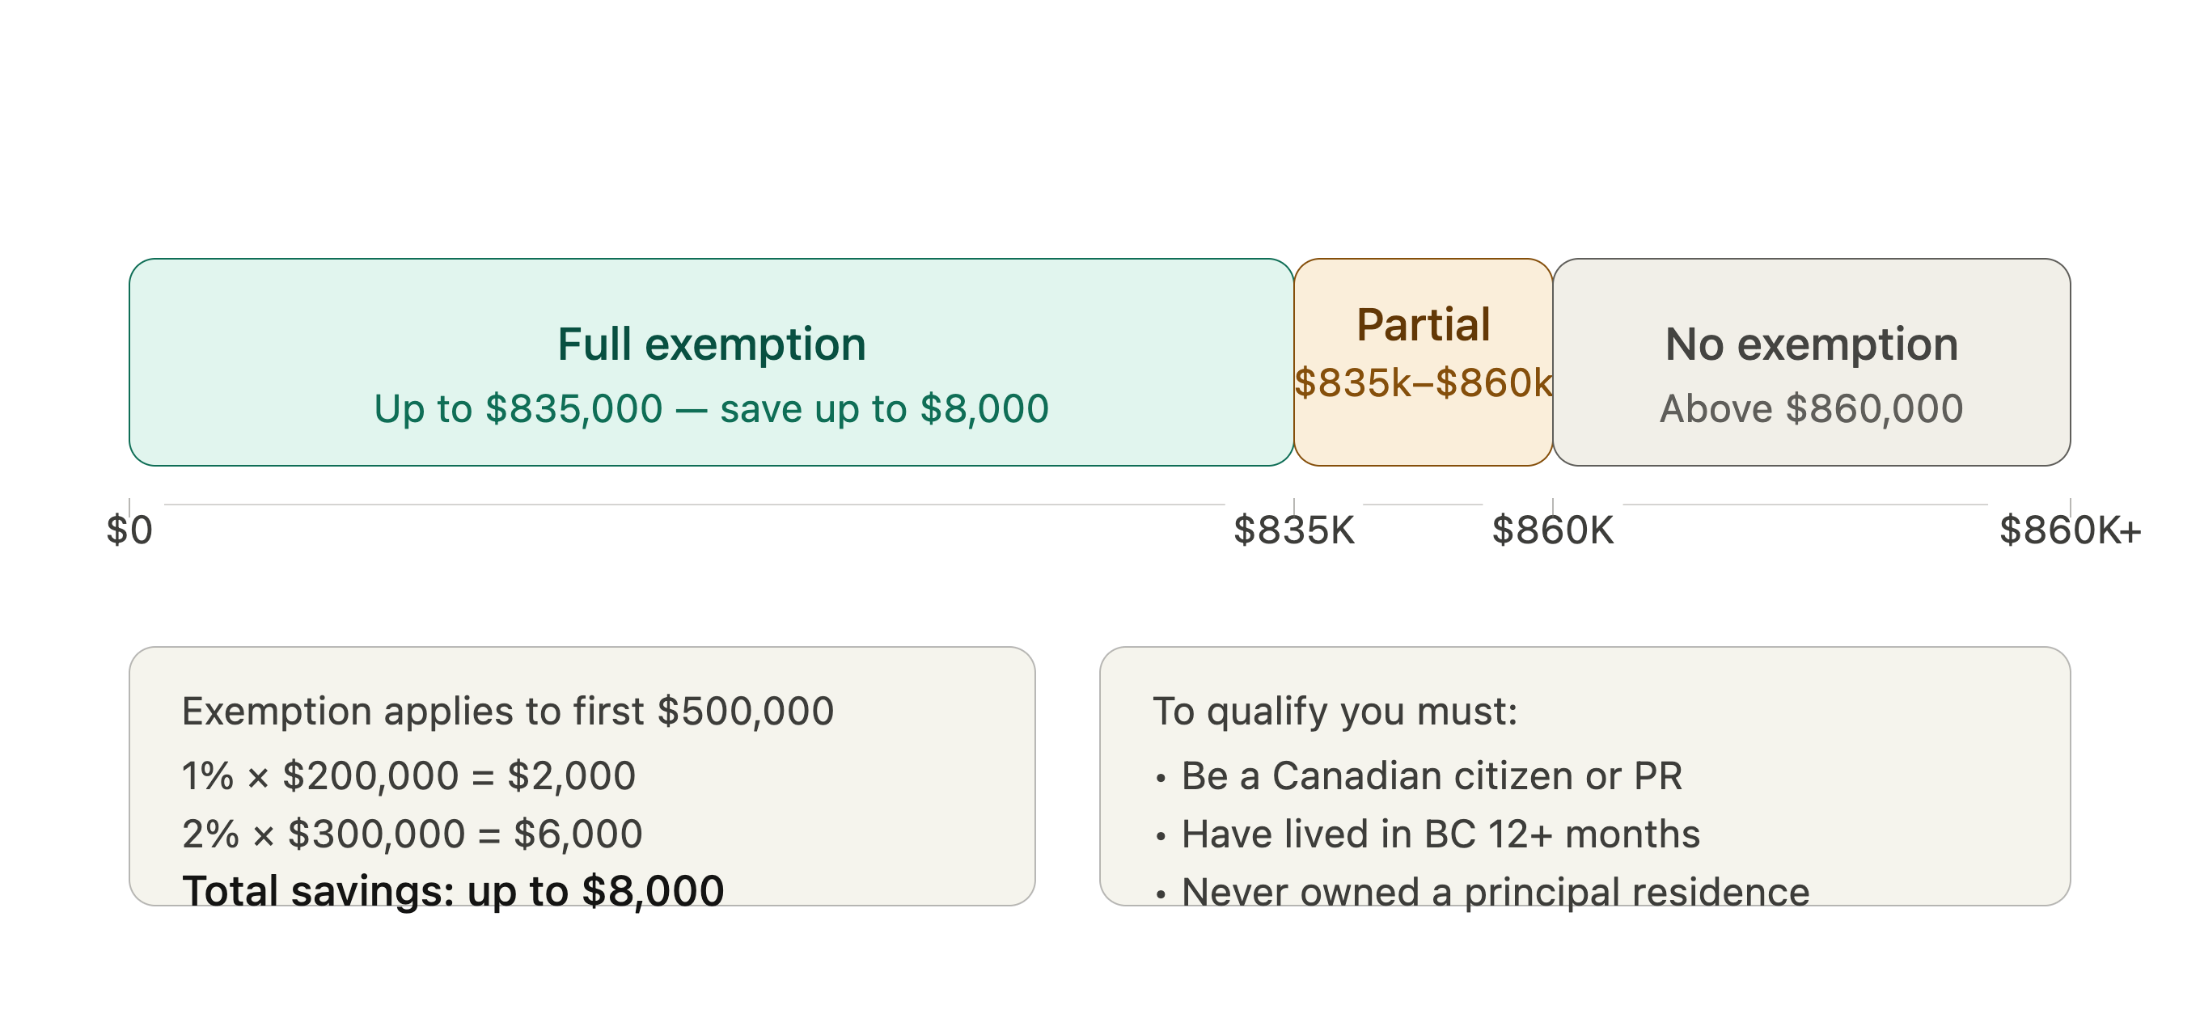
When you purchase a home in BC, you are required to pay a Property Transfer Tax (PTT). The general rate is 1% on the first $200,000 and 2% on the remainder up to $2,000,000.
The good news for first-time buyers is that there is an exemption available if you qualify. To be eligible, the property must be your principal residence, you must be a Canadian citizen or permanent resident, and you must have lived in BC for at least 12 consecutive months before your purchase date. The home must have a fair market value of $835,000 or less to receive the full exemption, with a partial exemption available for homes valued between $835,000 and $860,000. The exemption applies to the first $500,000 of the purchase price, which means eligible first-time buyers can save up to $8,000.
2. Know How Much You Actually Need Saved
Many first-time buyers focus on the down payment and forget about closing costs — and that can lead to some unpleasant surprises.
In addition to your down payment (a minimum of 5% for homes under $500,000 in Canada), you should plan for legal fees, home inspection costs, property tax adjustments, and moving expenses. A general rule of thumb is to budget an additional 1.5% to 4% of the purchase price for closing costs. Knowing your full number upfront helps you set realistic expectations and avoid stress later.

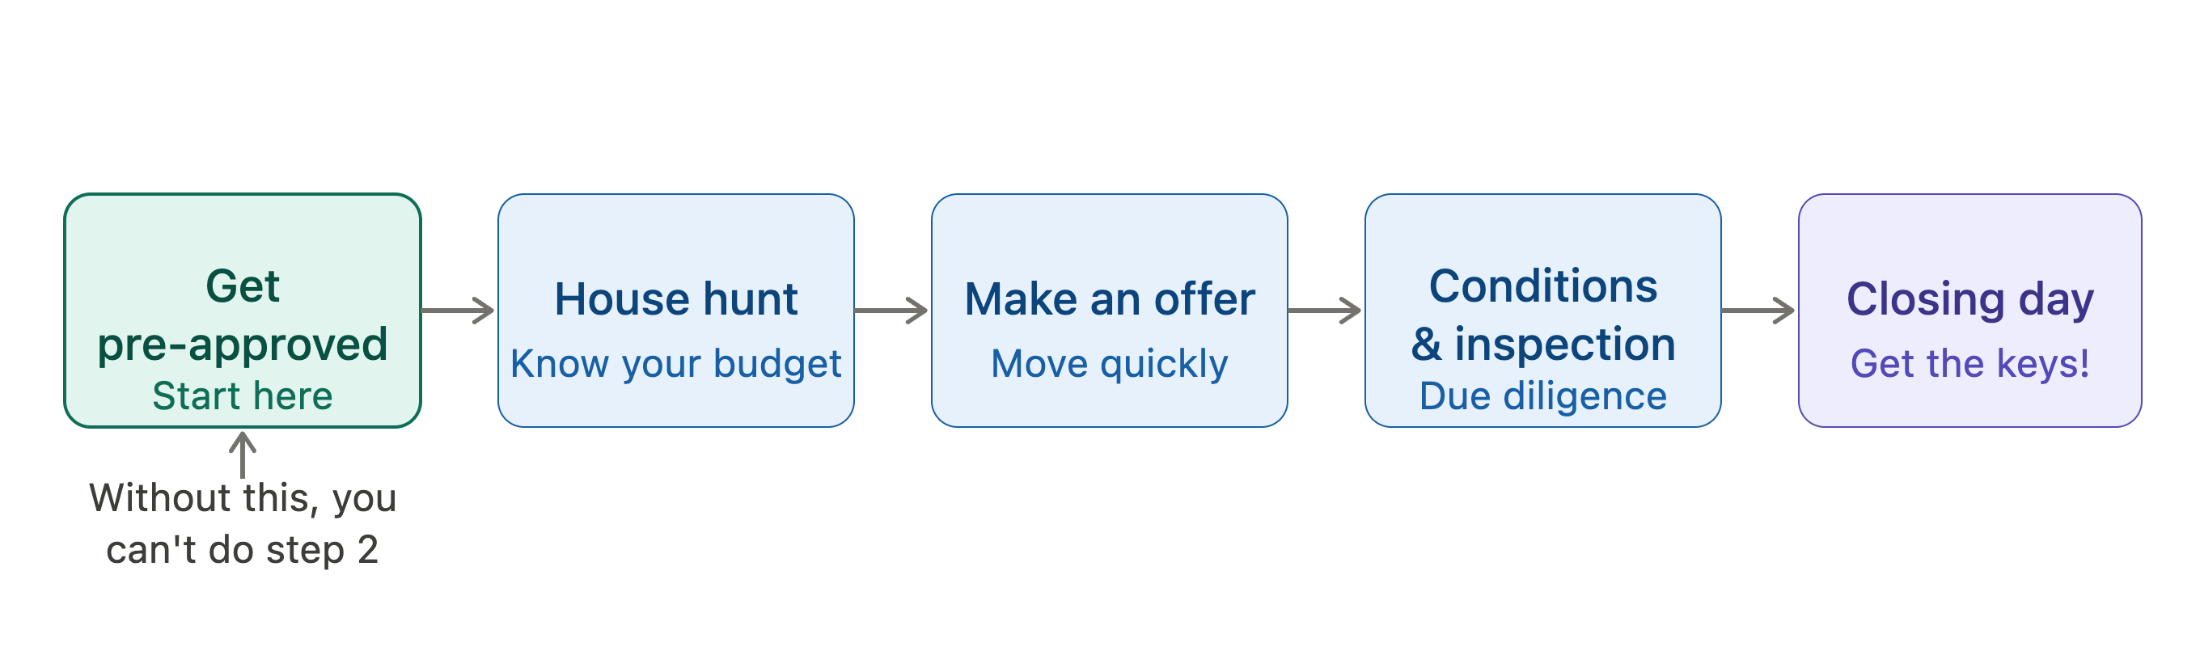
3. Get Pre-Approved Before You Start Looking at Homes
This one is more important than many buyers realize. A mortgage pre-approval tells you exactly how much a lender is willing to lend you, which means you can shop with confidence and make offers when you find the right home. Without a pre-approval, you risk falling in love with a home that isn’t within your budget — or losing out to another buyer who came prepared. In Richmond’s market, being ready to move quickly can make all the difference.
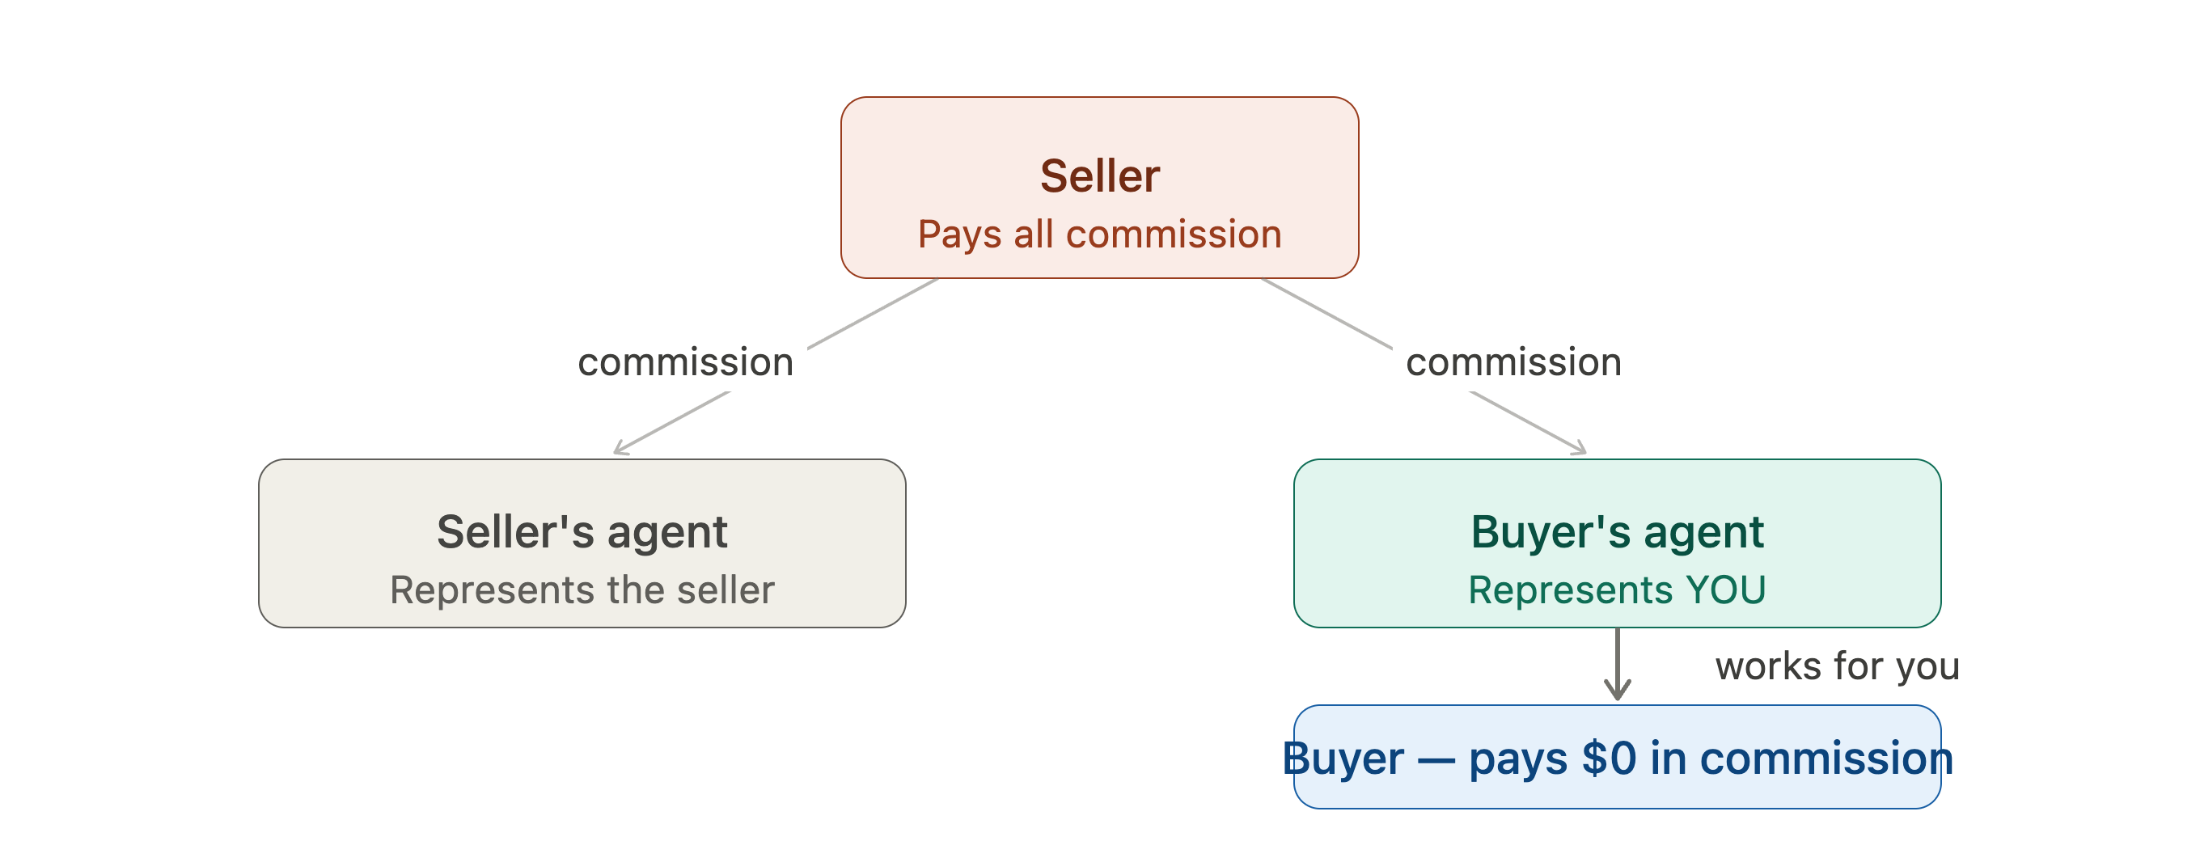
4. Working with a Buyer’s Agent Costs You Nothing
One of the most common misconceptions I hear from first-time buyers is that working with a realtor will cost them money. In BC, the seller typically pays the commission for both agents involved in a transaction. What this means for you as a buyer is that you get professional guidance, negotiation support, and someone looking out for your best interests — at no cost to you. There is really no reason not to have representation when buying a home.
5. Understand Strata Living Before You Buy a Condo or Townhouse
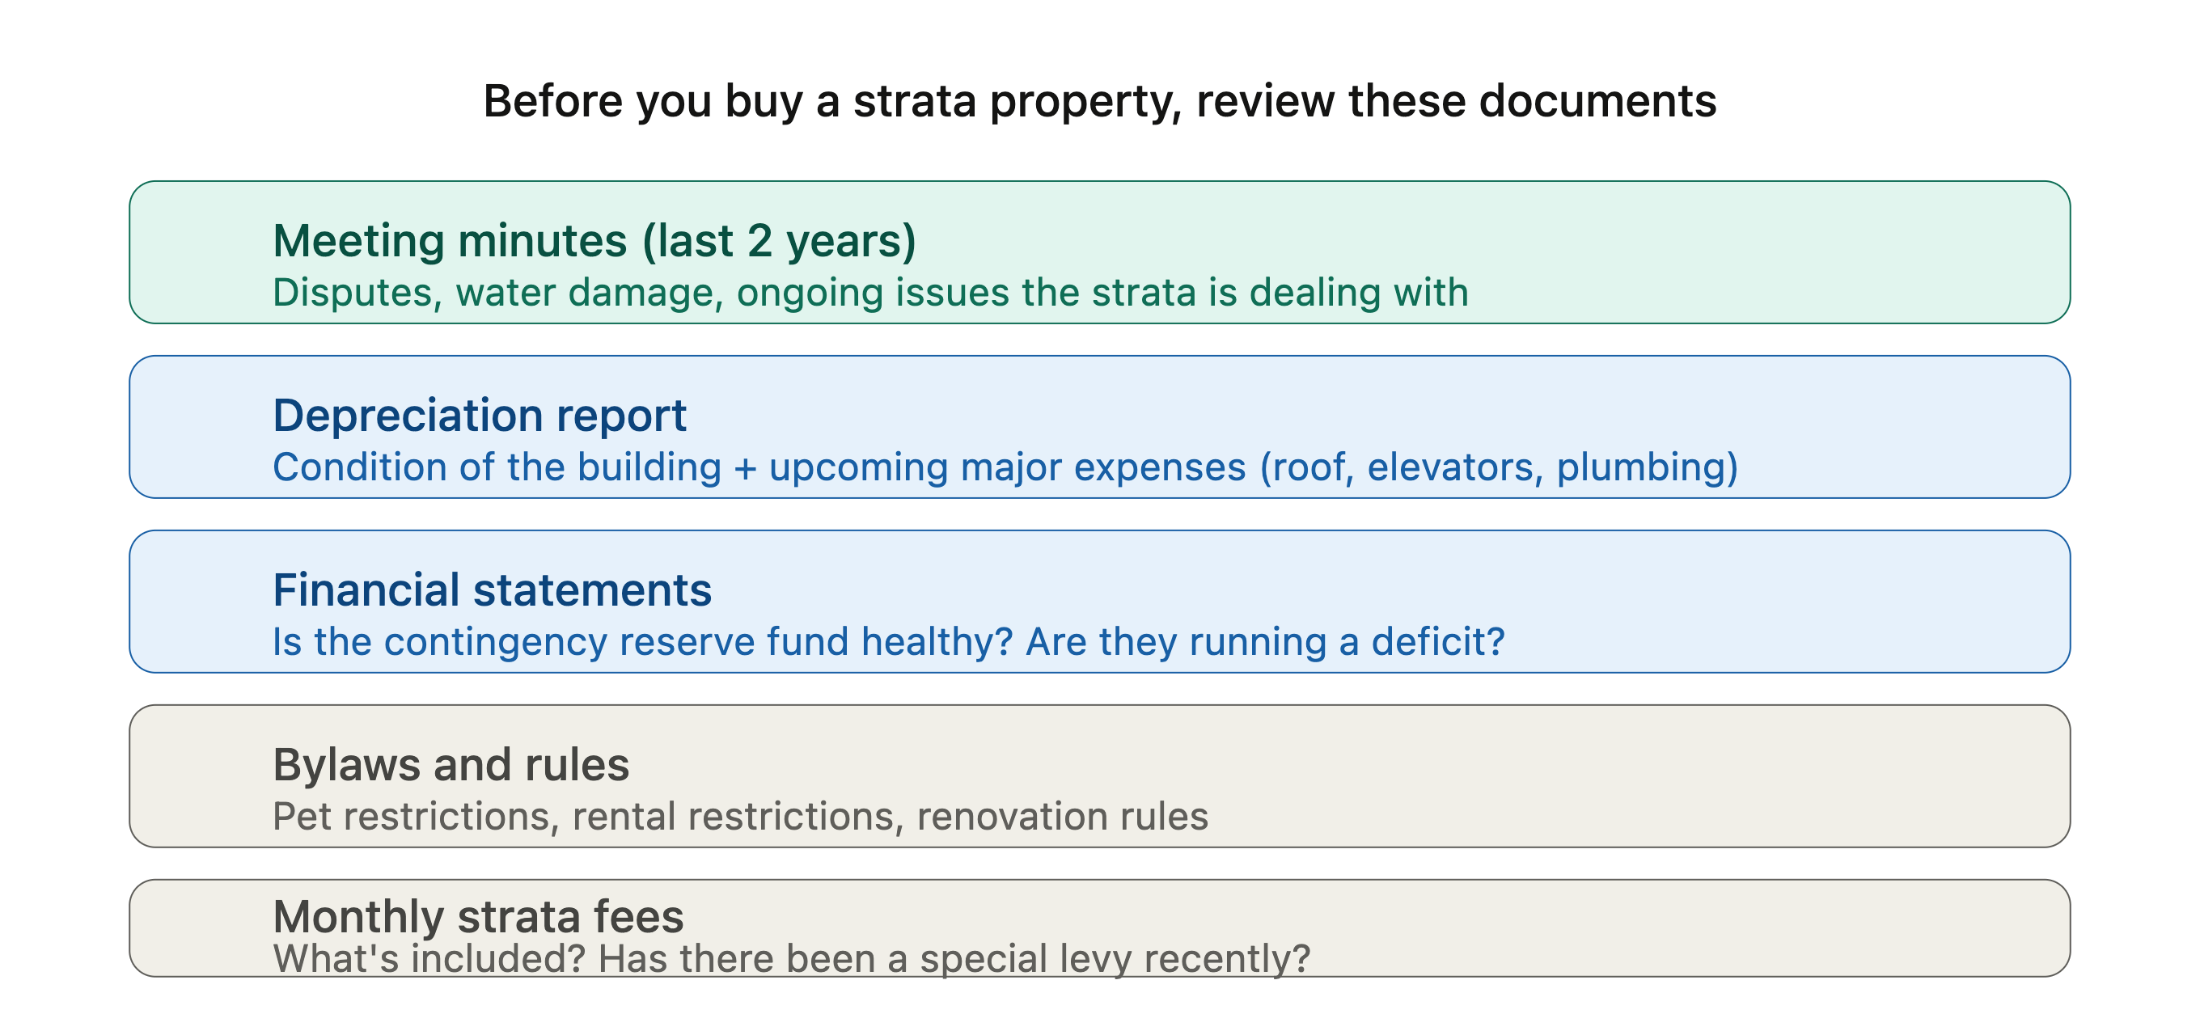
A large portion of Richmond’s housing market is made up of strata properties — condos, townhouses, and some detached homes that are part of a strata corporation. If you’re considering one of these, there are a few things you need to understand.
Every strata has monthly fees that cover shared expenses like building maintenance and insurance. You’ll also want to review the strata documents carefully, including the minutes from recent meetings, the financial statements, and the depreciation report. The depreciation report in particular tells you the current condition of the building and whether any major expenses are coming up. Understanding what you’re getting into before you make an offer can save you from a costly surprise down the road.
Final Thoughts
Buying your first home in Richmond is an incredible step, and going in informed makes the whole process so much smoother. If you have questions about any of these topics or want to talk through what buying in Richmond looks like for your situation, I’d love to help.


.JPG)
